[Prometheus] #1.Docker기반 Prometheus 설치 및 설정 가이드
Grafana/Prometheus Architecture
- 아래 그림에서 prometheus에 해당하는 부분에 해당함 - prometheus는 메트릭 데이터를 수집하고 저장하며, 이를 시각화하고 경고를 설정하는 기능을 제공한다. 메트릭 데이터는 시스템의 상태나 성능을 나타내는 지표로, CPU 사용량, 메모리 사용량, 디스크 용량 등 다양한 정보를 포함할 수 있다.
테스트 수행한 환경
- 인터넷가능한 환경, Rocky Linux 8.6, Docker가 구성된 환경
1. Prometheus docker-compose 구동을 위한 스크립트 준비
전체파일 구성
tree
├── create.sh
├── delete.sh
├── docker-compose.yml
├── log.sh
├── prometheus
│   ├── alert.rules
│   └── prometheus.yml
├── start.sh
└── stop.sh
1) docker-compose.yml 샘플
주요설정 설명
--storage.tsdb.path : Prometheus의 데이터베이스 경로.
--storage.tsdb.retention.time : 데이터 보관기간. 기본값은 15일이다.
--storage.tsdb.retention.size : 유지할 스토리지 블록의 최대 바이트 수. 오래된 데이터부터 제거하며 기본값은 0 또는 disable이다.
--web.enable-admin-api: 명령어를 통해 불필요한 데이터 삭제를 하기 위해 필요한 설정
vi  docker-compose.yml

version: '3.7'

networks:
  monitor-net:
    driver: bridge

volumes:
    prometheus_data: {}

services:

  prometheus:
    #image: prom/prometheus:v2.17.1
    image: prom/prometheus:latest
    container_name: prometheus
    volumes:
      - ./prometheus:/etc/prometheus
      - prometheus_data:/prometheus
    command:
      - '--config.file=/etc/prometheus/prometheus.yml'
      - '--storage.tsdb.path=/prometheus'
      - '--web.console.libraries=/etc/prometheus/console_libraries'
      - '--web.console.templates=/etc/prometheus/consoles'
      - '--storage.tsdb.retention.time=200h'
      - '--web.enable-lifecycle'
      - '--web.enable-admin-api'
    #restart: unless-stopped
    ports:
      - 9090:9090
    networks:
      - monitor-net
2) prometheus.yml 샘플 (prometheus 폴더에 생성 )
- global 영역은 전역적인 프로메테우스 설정을 관리합니다. scrape_interval은 각 대상을 수집하는 주기를 설정하며, evaluation_interval은 경고 룰을 평가하는 빈도를 설정한다.
- rule_files는 Alert 규칙 등 필요한 규칙을 작성해서 사용할 수 있는데 현재는 아무런 규칙을 지정하지 않았다.
- scrape_configs는 수집 대상을 정의한다. job_name은 대상의 이름을 지정하며, static_configs는 대상 서버의 주소를 설정한다.
targets는 대상 서버의 주소를 설정한다. 여기에서 다루지 않았지만 label을 추가하면 추후 grafana에서 검색등에 활용할 수 있다.
- alerting는 임계치 초과시 slack등으로 알람을 보낼때 사용할 수 있다. 여기에 해당하는 룰은 rule_files에서 설정하면되고, 해당 부분은 alertmanagers 부분에서 작성할 예정
mkdir prometheus;cd prometheus
vi prometheus.yml

global:
  scrape_interval:     15s
  evaluation_interval: 15s

  # Attach these labels to any time series or alerts when communicating with
  # external systems (federation, remote storage, Alertmanager).
  external_labels:
      monitor: 'docker-host-alpha'

# Load and evaluate rules in this file every 'evaluation_interval' seconds.
#rule_files:
#  - "alert.rules"

# A scrape configuration containing exactly one endpoint to scrape.
scrape_configs:
  - job_name: 'nodeexporter'
    scrape_interval: 5s
    static_configs:
      - targets: ['nodeexporter:9100']

  - job_name: 'cadvisor'
    scrape_interval: 5s
    static_configs:
      - targets: ['cadvisor:8080']

  - job_name: 'prometheus'
    scrape_interval: 10s
    static_configs:
      - targets: ['localhost:9090']

  - job_name: 'pushgateway'
    scrape_interval: 10s
    honor_labels: true
    static_configs:
      - targets: ['pushgateway:9091']

alerting:
  alertmanagers:
  - scheme: http
    static_configs:
    - targets:
      - 'alertmanager:9093'
3) 기타 docker 컨테이너 생성,삭제,구동,중지,로그조회 등 스크립트 작성
cat > create.sh <<EOF
#!/usr/bin/bash
docker-compose -f docker-compose.yml up -d
docker-compose -f docker-compose.yml logs -f
EOF

cat > delete.sh <<EOF
#!/usr/bin/bash
docker-compose -f docker-compose.yml down -v
EOF

cat > start.sh <<EOF
#!/usr/bin/bash
docker-compose -f docker-compose.yml start
EOF

cat > stop.sh <<EOF
#!/usr/bin/bash
docker-compose -f docker-compose.yml stop
EOF

cat > log.sh <<EOF
#!/usr/bin/bash
docker-compose -f docker-compose.yml logs -f
EOF

chmod +x *.sh
2. prometheus 정상구동여부 확인
### 구동하기
./create.sh

### 도커컨테이너 정상구동여부 확인
docker ps
CONTAINER ID        IMAGE                       COMMAND                  CREATED              STATUS              PORTS                    NAMES
9a803335a5ec        prom/prometheus:latest      "/bin/prometheus -..."   About a minute ago   Up About a minute   0.0.0.0:9090->9090/tcp   prometheus
3. prometheus 메트릭 데이터 조회
curl http://서버IP:9090/metrics

# HELP go_gc_duration_seconds A summary of the pause duration of garbage collection cycles.
# TYPE go_gc_duration_seconds summary
go_gc_duration_seconds{quantile="0"} 5.1272e-05
go_gc_duration_seconds{quantile="0.25"} 0.00016584
go_gc_duration_seconds{quantile="0.5"} 0.000400798
go_gc_duration_seconds{quantile="0.75"} 0.004019089
go_gc_duration_seconds{quantile="1"} 0.013519807
go_gc_duration_seconds_sum 0.035482116
go_gc_duration_seconds_count 11
# HELP go_goroutines Number of goroutines that currently exist.
# TYPE go_goroutines gauge
go_goroutines 50
# HELP go_info Information about the Go environment.
# TYPE go_info gauge
go_info{version="go1.19.7"} 1
# HELP go_memstats_alloc_bytes Number of bytes allocated and still in use.
# TYPE go_memstats_alloc_bytes gauge
go_memstats_alloc_bytes 3.1509928e+07
# HELP go_memstats_alloc_bytes_total Total number of bytes allocated, even if freed.
# TYPE go_memstats_alloc_bytes_total counter
이하 생략..
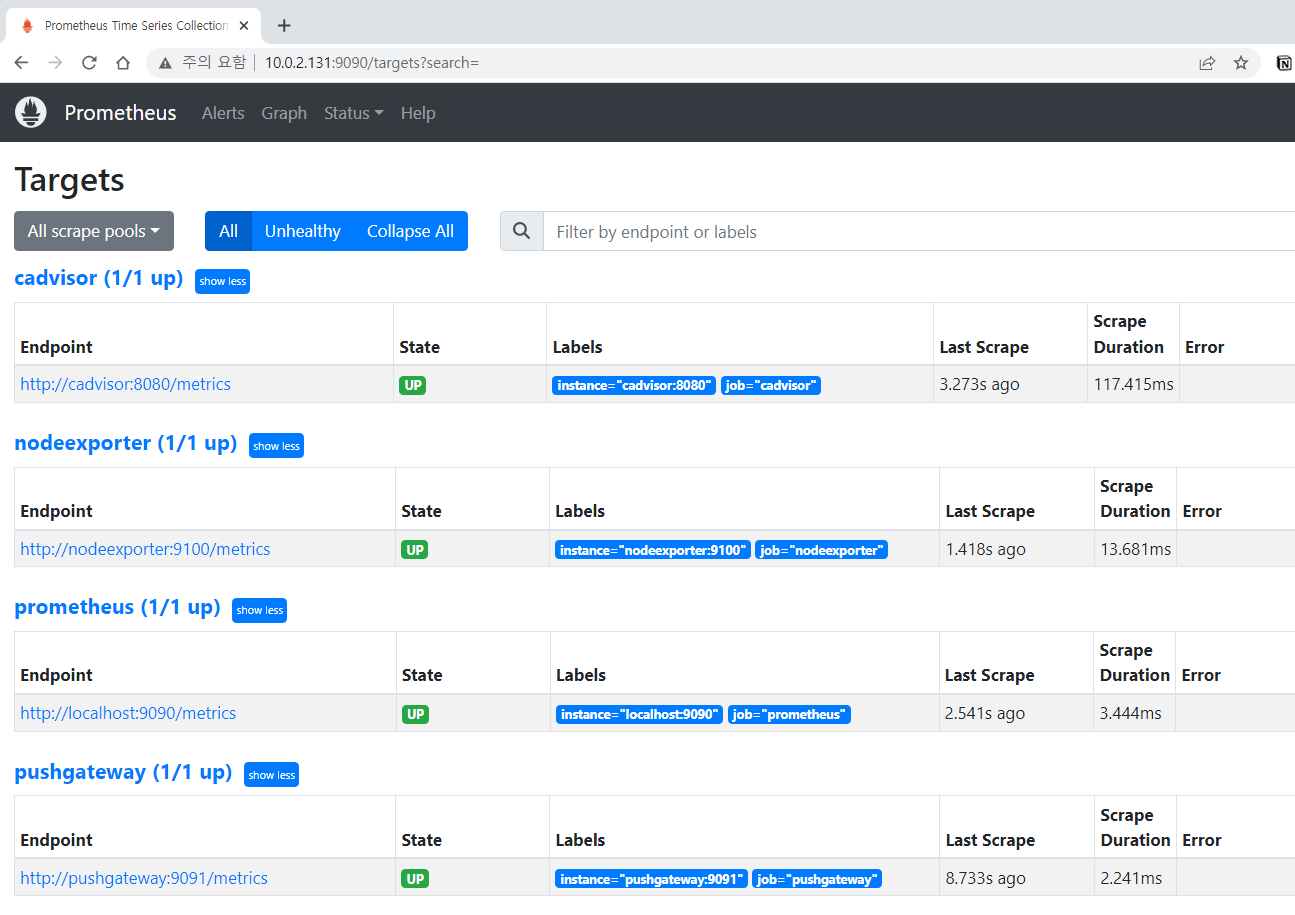
4. prometheus 대시보드 조회
- 접속URL: http://서버IP:9090/
접속하여 status메뉴에서 targets로 접속하면 prometheus를 통해 수집된 서버상태가 조회되고, Endpoint의 URL을 클릭하면 현재 수집된 메트릭 정보를 조회할 수 있다.
댓글남기기