[alertmanager] #5.Docker기반 alertmanager 설치 및 설정 가이드
Grafana/Prometheus Architecture
- 아래 그림에서 alertmanager 에 해당하는 부분에 해당함
- Prometheus alertmanager는 Prometheus에 의해 수집된 데이터에서 문제가 발생했다고 정의된 Rule에 의해 slack, hipchat 등을 통해 알람을 전송한다.
테스트 수행한 환경
- 인터넷가능한 환경, Rocky Linux 8.6, Docker가 구성된 환경
1. alertmanager docker-compose 구동을 위한 스크립트 준비
전체파일 구성
tree
├── alertmanager
│   ├── config.yml
├── create.sh
├── delete.sh
├── docker-compose.yml
├── log.sh
├── start.sh
└── stop.sh
1) alertmanager의 docker-compose.yml, config.yml (slack 연동) 샘플
주요설정 설명
- slack에서 web hook API 생성 및 alert를 받을 채널 생성 진행
- config.yml: alertmanager에서 발생한 알람을 slack web hook으로 보내는 설정 지정
mkdir alertmanager; cd alertmanager;
vi config.yml

global:
  slack_api_url: "https://hooks.slack.com/services/(생성한 정보)"
route:
  receiver: 'slack-notifications'
  repeat_interval: 2m
receivers:
  - name: 'slack-notifications'
    slack_configs:
    - channel: '#webhook'  # slack에서 생성한 채널 이름 지정
      send_resolved: true
      title: "\n"
      text: "\n"
- docker-compose.yml: 저장경로 및 config.yml 위치 지정
vi  docker-compose.yml

version: '3.7'

# monitor-net이름으로 이미 구성한 경우에는 networks부분은 주석처리
networks:
  monitor-net:
    driver: bridge

services:

  alertmanager:
    #image: prom/alertmanager:v0.20.0
    image: prom/alertmanager:latest
    container_name: alertmanager
    volumes:
      - ./alertmanager:/etc/alertmanager
    command:
      - '--config.file=/etc/alertmanager/config.yml'
      - '--storage.path=/alertmanager'
    #restart: unless-stopped
    ports:
      - 9093:9093
    networks:
      - monitor-net
2) prometheus에서 alert규칙 정의 및 해당파일 로딩
- alert규칙 정의: high_cpu_load, high_memory_load, high_storage_load, jenkins_down 등 정의
아래와 틀을 참고하여 작성, summary, description은 메시지와 변수값을 조합하여 문구 변경 가능
groups:
- name: host
  rules:
  - alert: high_cpu_load
    expr: node_load1 > 1.5
    for: 30s
    labels:
      severity: warning
    annotations:
      summary: "Server under high load"
      description: "Docker host is under high load, the avg load 1m is at . Reported by instance  of job ."

  - alert: high_memory_load
    expr: (sum(node_memory_MemTotal_bytes) - sum(node_memory_MemFree_bytes + node_memory_Buffers_bytes + node_memory_Cached_bytes) ) / sum(node_memory_MemTotal_bytes) * 100 > 85
    for: 30s
    labels:
      severity: warning
    annotations:
      summary: "Server memory is almost full"
      description: "Docker host memory usage is %. Reported by instance  of job ."

  - alert: high_storage_load
    expr: (node_filesystem_size_bytes{fstype="aufs"} - node_filesystem_free_bytes{fstype="aufs"}) / node_filesystem_size_bytes{fstype="aufs"}  * 100 > 85
    for: 30s
    labels:
      severity: warning
    annotations:
      summary: "Server storage is almost full"
      description: "Docker host storage usage is %. Reported by instance  of job ."

- name: containers
  rules:
  - alert: jenkins_down
    expr: absent(container_memory_usage_bytes{name="jenkins"})
    for: 30s
    labels:
      severity: critical
    annotations:
      summary: "Jenkins down"
      description: "Jenkins container is down for more than 30 seconds."
- prometheus.yml 에서 alert.rules 파일 로딩
cd prometheus
vi prometheus.yml

global:
  scrape_interval:     15s
  evaluation_interval: 15s

  # Attach these labels to any time series or alerts when communicating with
  # external systems (federation, remote storage, Alertmanager).
  external_labels:
      monitor: 'docker-host-alpha'

# Load and evaluate rules in this file every 'evaluation_interval' seconds.
# 아래 2줄 주석해제
rule_files:
  - "alert.rules"

# A scrape configuration containing exactly one endpoint to scrape.
scrape_configs:
  - job_name: 'nodeexporter'
    scrape_interval: 5s
    static_configs:
      - targets: ['nodeexporter:9100']

  - job_name: 'cadvisor'
    scrape_interval: 5s
    static_configs:
      - targets: ['cadvisor:8080']

  - job_name: 'prometheus'
    scrape_interval: 10s
    static_configs:
      - targets: ['localhost:9090']

  - job_name: 'pushgateway'
    scrape_interval: 10s
    honor_labels: true
    static_configs:
      - targets: ['pushgateway:9091']

alerting:
  alertmanagers:
  - scheme: http
    static_configs:
    - targets:
      - 'alertmanager:9093'
3) docker 컨테이너 생성,삭제,구동,중지,로그조회 등 스크립트 작성
cat > create.sh <<EOF
#!/usr/bin/bash
docker-compose -f docker-compose.yml up -d
docker-compose -f docker-compose.yml logs -f
EOF

cat > delete.sh <<EOF
#!/usr/bin/bash
docker-compose -f docker-compose.yml down -v
EOF

cat > start.sh <<EOF
#!/usr/bin/bash
docker-compose -f docker-compose.yml start
EOF

cat > stop.sh <<EOF
#!/usr/bin/bash
docker-compose -f docker-compose.yml stop
EOF

cat > log.sh <<EOF
#!/usr/bin/bash
docker-compose -f docker-compose.yml logs -f
EOF

chmod +x *.sh
2. alertmanager 정상구동여부 확인
### 구동하기
./create.sh

### 도커컨테이너 정상구동여부 확인
docker ps
CONTAINER ID        IMAGE                       COMMAND                  CREATED             STATUS              PORTS                    NAMES
9aa75935693b   prom/alertmanager:latest    "/bin/alertmanager -…"   6 days ago   Up 4 seconds   0.0.0.0:9093->9093/tcp, :::9093->9093/tcp   alertmanager
3. 구동화면 예시
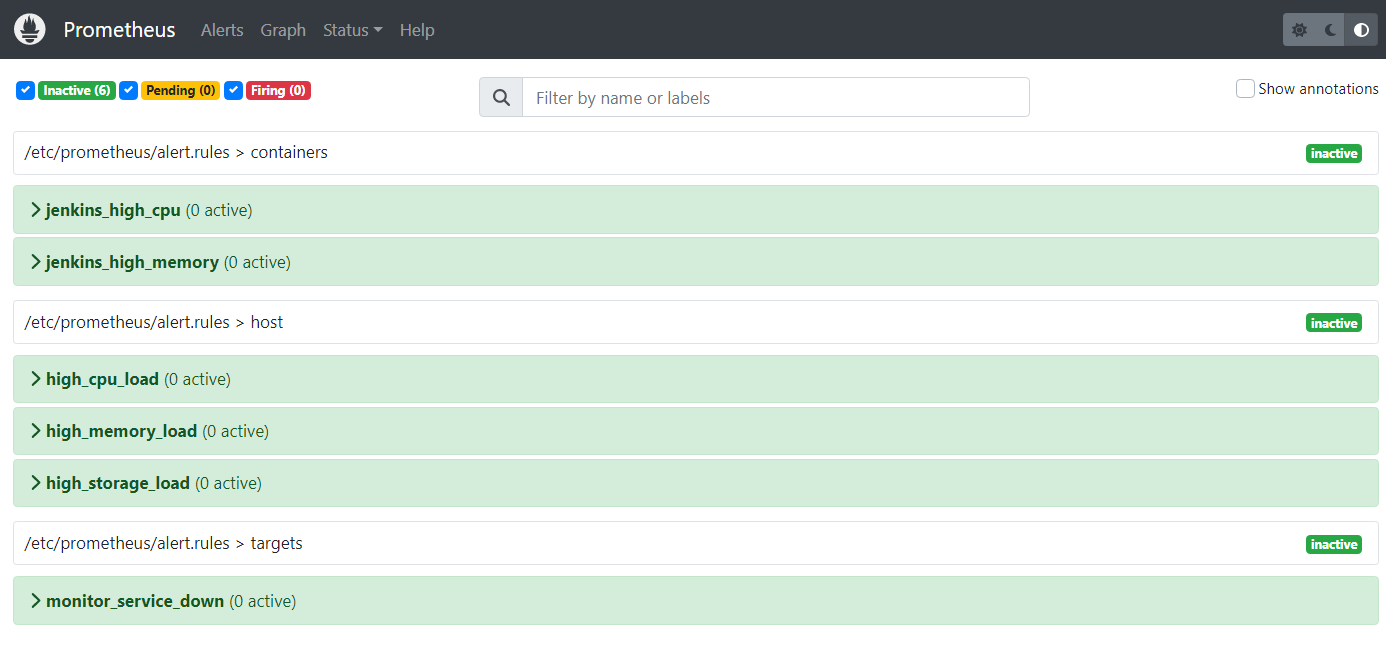
- prometheus Alerts 대시보드 예시: http://아이피:9090/alerts?search=
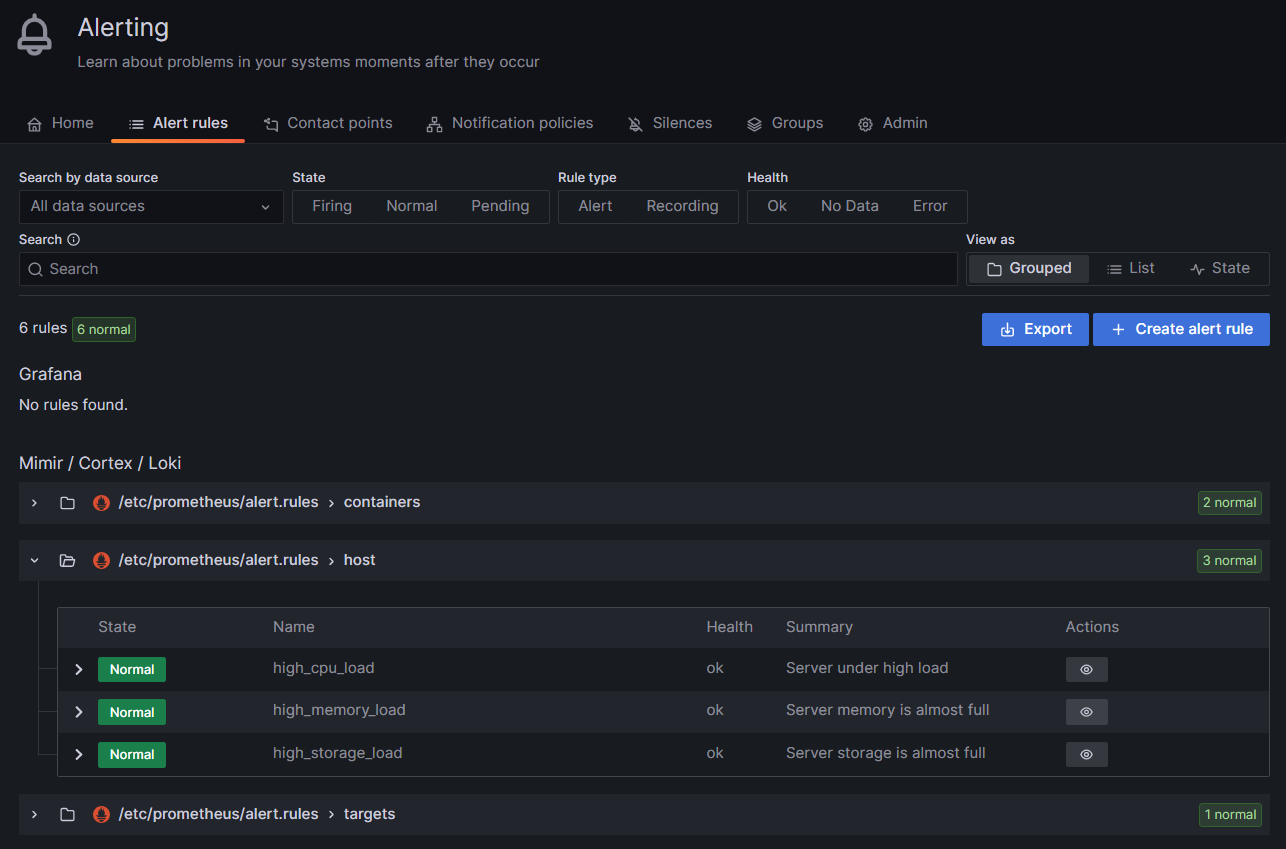
- Grafana Alerts 대시보드 예시: http://아이피:3000/alerting/list
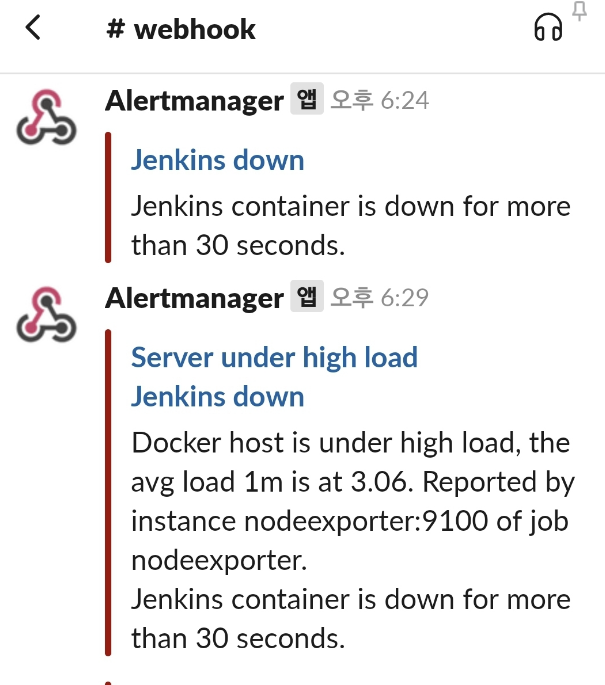
- Slack channel 조회 예시
prometheus alert.rules 파일에서 정의된 룰에 의해 발생한 것이 alertmanager의 config.yml에 정의된 채널로 전송됨
댓글남기기